Current Performance

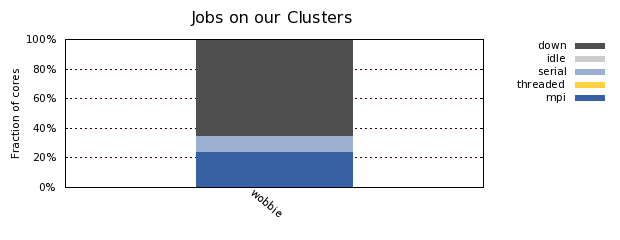
Current Cluster Performance
| Cluster | Alert | Total Cores | Up Cores | Idle Cores | Running Jobs | MPI Jobs | Serial Jobs | Threaded Jobs | Susp'd Jobs | Q'd Jobs | % Cap. | GFLOPS | Last Polled | Status |
|---|---|---|---|---|---|---|---|---|---|---|---|---|---|---|
| wobbie | 1,440 | 173 | 0 | 252 | 41 | 199 | 12 | 0 | 3 | 100% | 687 | Apr 9 14:56 | Downtime soon | |
| Summary | N/A | 1,440 | 173 | 0 | 252 | 41 | 199 | 12 | 0 | 3 | 100% | 687 | N/A | N/A |
Recent Cluster Statistics
| Cluster | Jobs per Hour | Processes per Hour | Serial Wait (hours) | 2 Core Wait (hours) | 4 Core Wait | 8 Core Wait | 16 Core Wait | 32 Core Wait | 64 Core Wait | 128 Core Wait | 256 Core Wait | 512 Core Wait | Serial Job Length (hours) | MPI Job Length (hours) | Average MPI Size |
|---|---|---|---|---|---|---|---|---|---|---|---|---|---|---|---|
| wobbie | 0.0 | 0.0 | 899.4 | 2,583.3 | 5,682.9 | ||||||||||
| Summary | 0.0 | 0.0 | 899.4 | 2,583.3 | 5,682.9 | 0.0 | 0.0 | 0.0 |
Table Notes
Jobs per Hour represents the average number of jobs that have completed per hour in the last 24 hours. Processes per Hour represents the number of CPUs freed by these completing jobs.
For wait times, multi-processor jobs are binned into the next highest power of two. For example, 20-way jobs are binned with 32-way jobs. All wait times are in hours and the numbers represent the average wait time of all jobs active in the last two week period, including jobs that have not yet started.
Serial job length and MPI job length are averaged over jobs that have completed in the last week. Average MPI size represents the average size of multi-processor jobs submitted in the last week.

